
ISSUE 26
Percentage of Residents Over
Exposed to Nitrogen Dioxide
Eindhoven 1,1 %
Den Haag 3,2 %
Utrecht 4,3 %
Rotterdam 6,8 %
Amsterdam 9,8 %
ISSUE 27
Price Increases of Basic Supermarkt
Products May-June 2008 In Relation
to The Same Time Last Year
Dutch Cheese + 18%
Apples + 16%
Tomatoes + 14%
Large Bread + 7%
Beefsteak + 3%

ISSUE 28
According to Visitors, This is When
Someone Has Had Too Much to Drink
05 glasses 11,11%
6–10 glasses 51,6 %
11–15 glasses 22,2%
16–20 glasses 1,7 %
> 20 glasses 4,4%

ISSUE 29
The Most Romantic Spots
According to City Residents
Vondelpark 22,6%
Leidseplein 6,9%
Grachtengordel 3,9%
Dam 3,3%
Hortus 2,2%
ISSUE 30
Number of Prescriptions Per Year for
Attention Deficit Hyperactivity Disorder
(ADHD) in the Netherlands
1998 100.000
2000 180.000
2002 210.000
2004 300.000
2006 470.000
2008 730.000*
*estimate based on first quarter 2008

ISSUE 31
Registered Criminal Acts per
1000 Residents in 2007
Rotterdam 140
Maastricht 149
Eindhoven 150
Utrecht 162
Amsterdam 170

ISSUE 32
Methods Used by Citizens
to Influence Politicians
Join action group 4%
Join political party 5%
Take part in a demonstration 8%
Contact politician 10%
Discuss via internet,
email or SMS 18%

ISSUE 33
% of Dutch Citizens
Against European Union
1994 30%
1998 33%
2002 40%
2006 55%
ISSUE 34
% of Students Who Say That Their
Ambition over the Next Five Years
is to Grow Intellectually
2005 73%
2007 60%

ISSUE 35
% of Residents of a
Non- Western Background
Bijlmer 82%
Diamantbuurt 40%
Pijp 23%
Jordaan 12%
Museumkwartier 10%
ISSUE 36
% Breakdown of Creative Talents in
the Dutch Cultural Sector 2004–2006
Dance & Theatre 5%
Artists 7%
Music 13%
Language & Other 18%
Design & Architecture 57%
ISSUE 37
Internet Use of Inhabitans
of Amsterdam
2003 73%
2004 79%
2005 81%
2006 84%
2007 86%

ISSUE 38
Amsterdammers on
Proposed Squatting Ban
For 19,7%
More than against 16,5%
More against than for 19,5%
Against 14,7%
Don't know 2,6%

ISSUE 39
Should the Building of
Noord/Zuidlijn Continue?
Once it's clear what went wrong,
a new choice should be made 35%
It should just continue 35%
There are too many risks,
the building must stop 13%
No opinion 12%
Other opnion 4%

ISSUE 40
Number of Winegrowers
in the Netherlands
2004 30
2007 68

ISSUE 41
Drops of Profit in Horeca July
and August Vompared with
Same Time Last Year Since
Introduction of Smoking Ban
Average 4,4%
Cafes 26%
Clubs 31%
ISSUE 42
Genetic Background of the
Population in the Netherlands
78% Stone Age Hunter-Gatherers
19,5% Neolithic Farmers
2,5% More recent Immigration,
mostly Asia

ISSUE 43
The Dutch Do Not Worry About
Global Problems
53% doesn't worry much or not
at all about water shortage in future
40% couldn't care less about
future worldwide food shortage

ISSUE 44
Self-Knowledge in Corporate
Employees
66% believe that self- knowledge
is necessary to reach their potential
64% follow intuition often or very often
50% do not feel a bond with their work
50% believe that a boss is empathetic
whenever they admit to not feeling
in good mental form
33% do not think they know them-
selves well
18% believe that all their dimensions
can be used for the good of their job.

ISSUE 45
How Would You Adjust Your
Weekly Work Hours?
Cleaners + 3,5
Truck drivers + 3,1
Horeca + 2,5
Child / Senior Care + 1,6
Construction - 2,5
IT - 2,5
Industry - 2,5
(Based on this study, the
ideal work week is considered
to be 25—28 hours.)

ISSUE 46
Name a quiet spot
Begijnhof 26%
Vondelpark 21%
Hofjes, Grachtjes &
Jordaan 13%
Westerpark &
Westergasterrein 12%
Hortus & Artis 9%

ISSUE 47
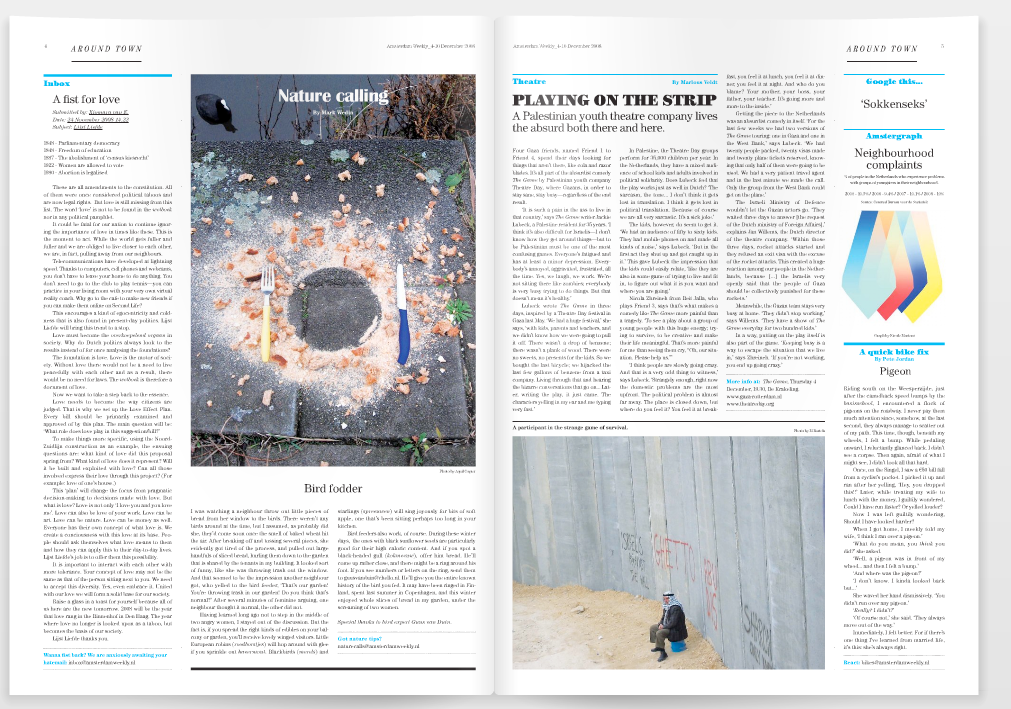
Neighbourhood Complaints?
% of People in the Netherlands
to Experience Problems With
Groups of Youngsters in Their
Neighbourhood
2005 10,3%
2006 9,4%
2007 10,1%
2008 10%
Source: CBS

ISSUE 48
Dutch Maroccans.
% of Amsterdammers
with a negative image
of Dutch Maroccans
2006 45%
2007 41%
2008 32%
ISSUE 49
Number of Firework Victims
Requiring First Aid on New Year's
Eve in the Netherlands
1996—97 1.100
2000—01 900
2004—05 620
2007—08 1.100
Source: Consument en Veiligheid
ISSUE 44
Amstergraph in action.
Screenshot of ISSU